If these images already look great, try to imagine them in a 360º Spherical Planetary Projector! We have recently designed a software and interface for this special kind of projector and its ready for an educational use as well as to liven up the room.
They are not common but they do exist, 360º projectors are devices that display images in spherical screens. They may not be very useful in everyday life but are just perfect for planetary projections. Our colleagues of the CESAR educational project at ESAC wanted one with this purpose in their visitor centre and we designed the software for them. Once installed it’s very easy to use: with the touch screen you can change between any of the preloaded models, yo just have to select what you want to see and the computer does the rest. The selected map will be displayed in the sphere, you can move closer to see details and move around to see the other side, or you may activate the rotating option and let the computer constantly rotate the planet for you.
Besides the ornamental use, this Planetary Projector is perfect to explain many features about Earth and other bodies of the Solar System, or to let students explore these bodies by themselves and encourage them to obtain conclusions.
These are only some of the maps that we have projected at some point:
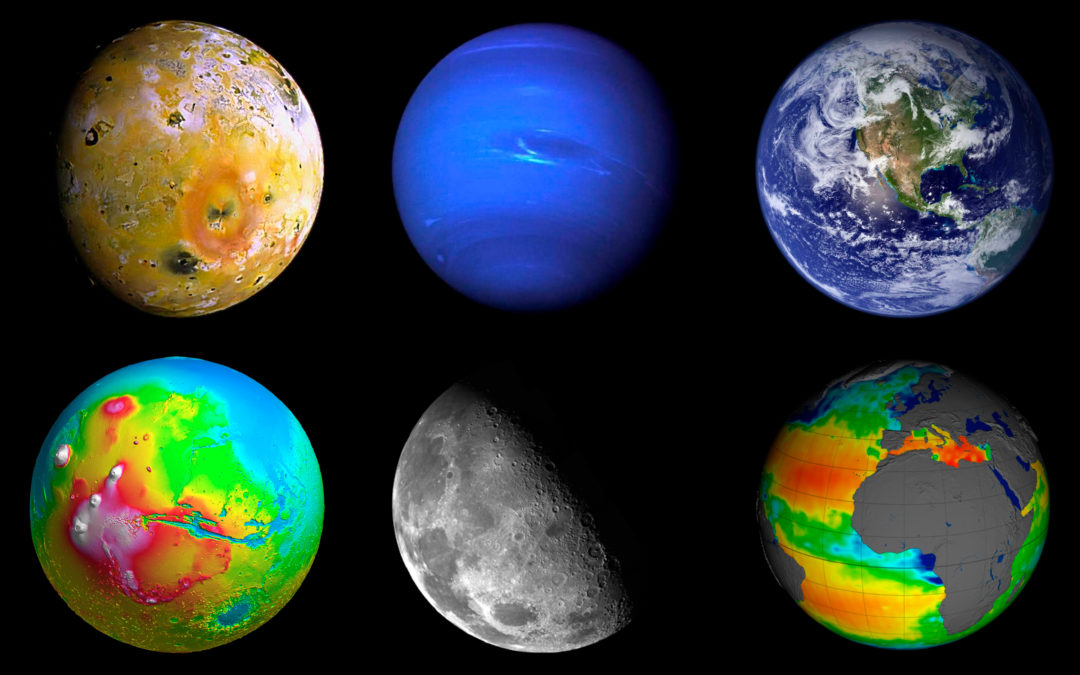
- Earth Visual Map: Imagine Google Earth in 360º. This is what visitors see when the Earth Visual Map is activated. Created with data provided by Landsat satellites from NASA‘s and USGS’s (the U.S. Geological Survey) Landsat program and by Sentinel and other satellites associated to the Copernicus program from the European Commission (EC) and the European Space Agency (ESA), our Earth map is accurate and up to date. Both the Landsat and the Sentinel programs are Earth observation missions that everyday take pictures of us from space. The obtained data can be used by those who work in agriculture, geology, forestry, regional planning, education, mapping, and global change research. At CESAR students use the Earth Visual Map to explore Earth’s surface, trying to explain the distribution of vegetation, or to understand continental drift, or some other feature of our planet.
- Earth’s Geoid: A geoid defined by a gravity field, is a surface of equal gravitational potential. In other words, Earth’s geoid is a map of Earths gravity. Goce ESA’s mission measured Earth’s gravity field with unprecedented accuracy and provided data to create a 3D high accuracy geoid. This is crucial for deriving measurements of ocean circulation, sea-level change and terrestrial ice dynamics, all of which are affected by climate change. At ESAC, Earth’s geode is represented with a color gradient in the Planetary Projector, and used to explain Earth’s gravity field and its consequences.
- SMOS Maps: ESA’s Soil Moisture and Ocean Salinity (SMOS) mission is dedicated to making global observations of soil moisture over land and salinity over oceans. Ocean salinity and soil moisture maps created with the data provided by SMOS are often displayed and explained at ESAC with the projector.
- The Sun: Different maps of the Sun are preloaded in the 360º Spherical Planetary Projector. Created with data from the ESA-NASA mission SOHO, the Sun projections are used to explain the different features that appear on the surface of the Sun and the differential rotation of the surface itself. SOHO is a scientific mission and our main source of near-real-time solar data. It was launched in 1995 and was meant to operate until 1998, but it is so successful that has already seen several extensions, and currently its 12 main instruments are fully operational, sending daily different types of images and data of the Sun.
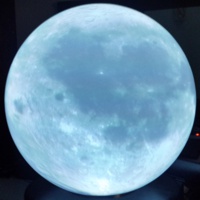
- The Moon: Two images of the Moon from NASA’s mission Lunar Reconnaissance Orbiter (LRO) are oftentimes displayed. The first one is the known-by-all near side of the moon, and it’s used to explain Moon phases. The second one is a full 360º image showing both the near side and the dark side, and can be used to explain the main features in Moon’s surface.
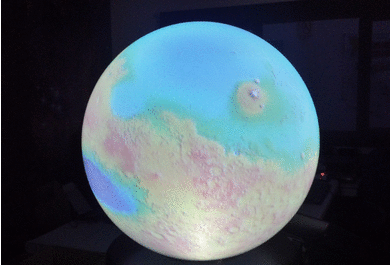
- Topography: Topography is the study of the shape and features of a place or an astronomical object’s surface. Hence, a topographic map shows the altitude of each point in a planet or a moon. We display topographic maps of the Earth, Mars and the Moon, provided by NASA missions Terra, Mars Global Surveyor and LRO respectively. This maps are very useful to explain geological formations in other planets or to do an exercise in which students have to look for a landing place.
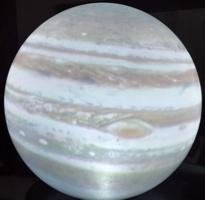
- Moons and Planets: Finally, we display 360º images of the main moons and planets of our Solar System, sometimes to accompany an explanation about the object and some other times just to liven up the room. We have images of Mercury from NASA’s Messenger, of Venus from NASA’s Magellan, of Mars from NASA’s marstrek, of Jupiter from the ESA-NASA Hubble, from Jupiter Moon’s thanks to NASA’s Galileo and Voyagers, of Saturn and Titan from the ESA-NASA-ASI Cassini/Huygens, of Uranus and Neptune thanks to NASA’s Voyager 2, and of Pluto thanks to NASA’s New Horizons.
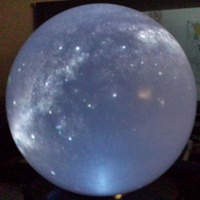
In addition to this maps/images, we can also project 360º videos, pictures of the night sky, light pollution maps and any other thing you may come up with. Once you start, you never stop finding applications of this technology.
Cover Image © ESA – NASA